
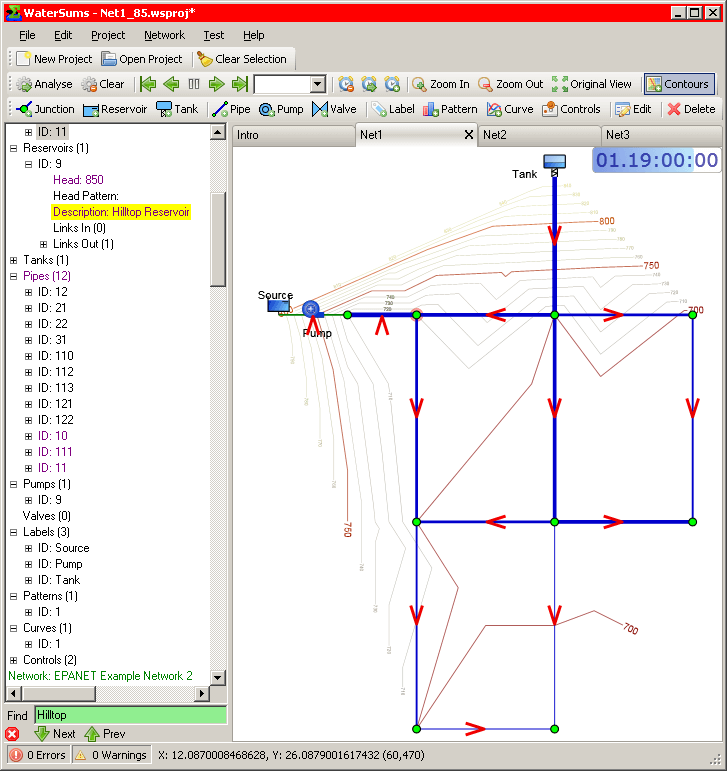
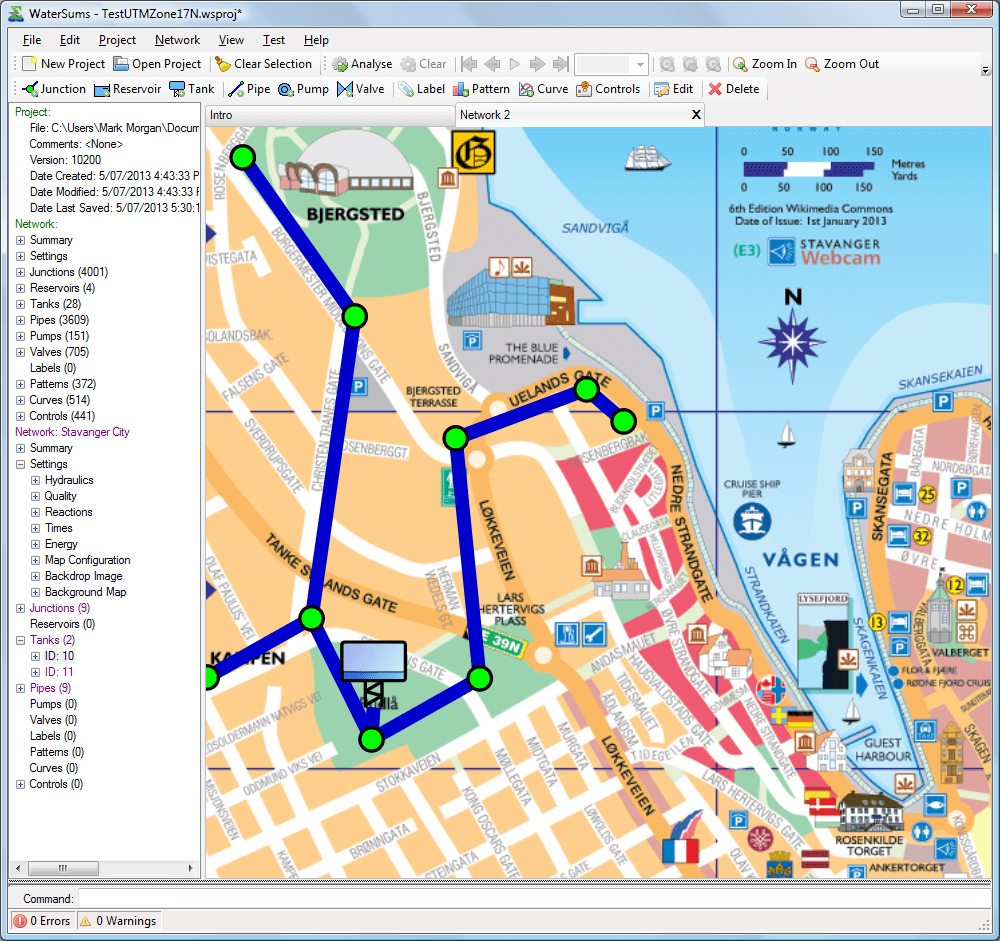
WaterSums Demo Project
There are 3 network tabs - the project contains 3 networks loaded by drag and drop. The reservoir selected in the tree is highlighted in the network map - all selections made in the map [...]
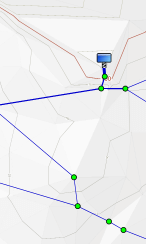
Automatically generated map contours
Map contours are generated from the elevations of the network nodes. The Contours button on the Network Toolbar toggles the display of contours.
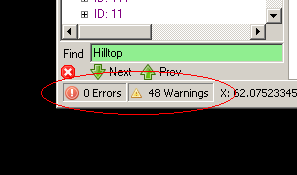
Network Analysis Summary area of status bar
Automatic background analysis is enabled by default. Whenever a network is modified, auto-analysis is triggered and a summary or the results (number of errors/warnings) is displayed in the analysis result summary area at the left [...]
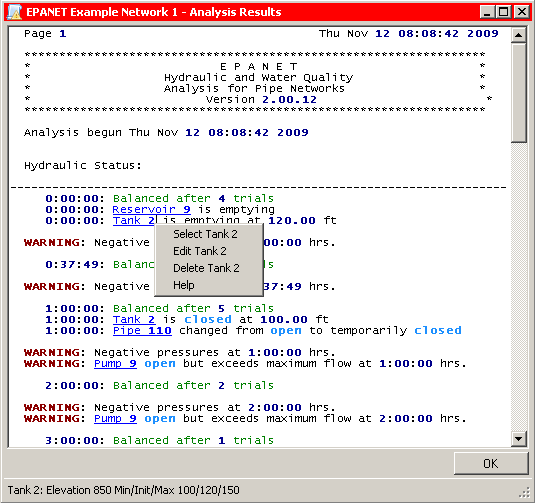
Analysis Report Viewer
Network analysis result output files are now displayed in a customised file viewer panel which highlights errors and warnings. References to network objects are displayed with hyperlinks. Clicking on the hyperlink selects the object referred [...]
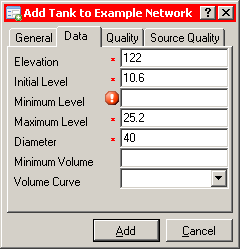
Dialog for adding a new Tank
Tabbed panel for entering data when creating new Tank or editing an existing Tank Mandatory fields are marked with a red asterisk (*) to the left of the field Invalid or missing values are marked [...]
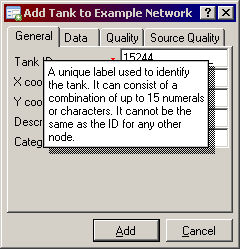
Popup help in Property Editor
Clicking on the question mark icon '?' turns the cursor into a question mark and popup help is then given when the user clicks on a control. More detailed help is generally available by pressing [...]
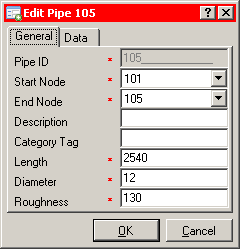
Pipe Property Editor
Tabbed panel for entering/editing data when editing an existing Pipe Mandatory fields are marked with a red asterisk (*) to the left of the field Invalid or missing values will be marked with an exclamation [...]
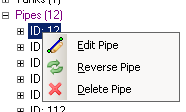
Typical context menu on right-click in Project Tree
Menus displayed when right-clicking on branches of the Project Tree are context sensitive and include entries appropriate for the branch being clicked on.
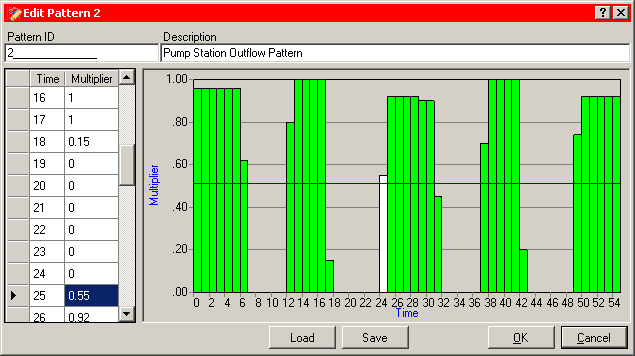
Pattern Editor
Patterns can be used when values vary discretely with time. Patterns specify multipliers of a given value as it varies through the time steps of a simulation.
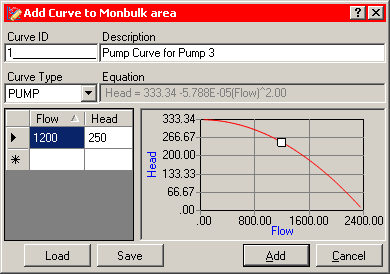
Curve Editor
Curves describe a relationship between two variables. Two or more network objects can share the same curve. A curve will be one of the following types: Pump curve Efficiency curve Volume curve Headloss curve
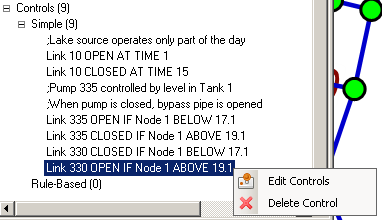
Controls displayed in Project Tree
Controls mandate the behaviour of links (pipes, pumps or valves) based on time or other conditions in a network. Simple Controls have a very simple syntax while Rule-based Controls can be much more complex. The [...]
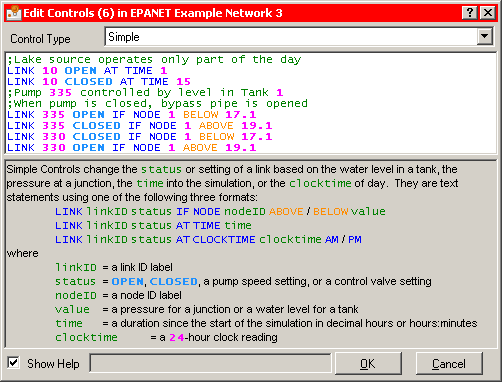
Control Editor
Controls are edited in the Control Editor which displays the text of all controls with syntax highlighting and auto-completion. Syntax is checked as the user typed and references to network objects are also checked to [...]
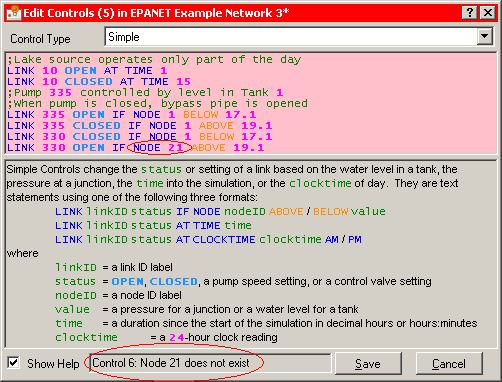
Control Editor (with error)
Controls are edited in the Control Editor which displays the text of all controls with syntax highlighting and auto-completion. Syntax is checked as the user typed and references to network objects are also checked to [...]
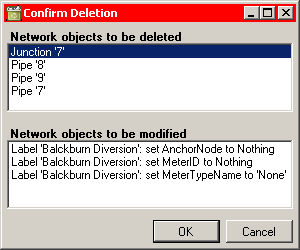
Deletion and refential integrity checks
Referential integrity is important. Whenever a network object refers to another object, WaterSums must ensure that the object really exists. Sometimes, when items are deleted, other items may be depending on them: for example a [...]
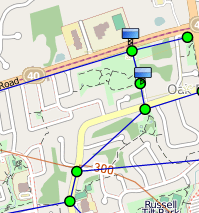
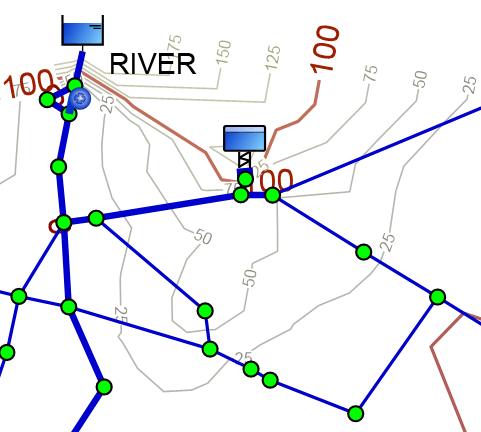
Network with OpenStreetMap (© OpenStreetMap contributors) displayed in the background
A small example of a network with OpenStreetMap in the background. OpenStreetMap maps are available under an open licence, so WaterSums can display these maps without any extra licence fees or complexity. We satisfy the [...]
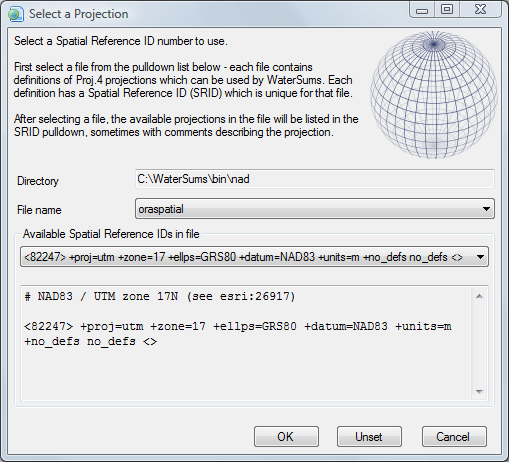
Projection Selection panel
WaterSums uses the Proj.4 cartographic projections library internally and provides a panel for selecting from the available projections.
Automatically generated terrain shading
WaterSums can automatically generate terrain shading based on the elevations given in a network model for junctions, tanks and reservoirs. This process is experimental at the moment, but can help significantly with the visualisation of [...]
Network with a backdrop image
Backdrop image shown in WaterSums showing how network can be digitised on top of a map. The backdrop image is a map of Stavanger City in Norway by Kevin Paul Scarrott. This picture is licensed [...]
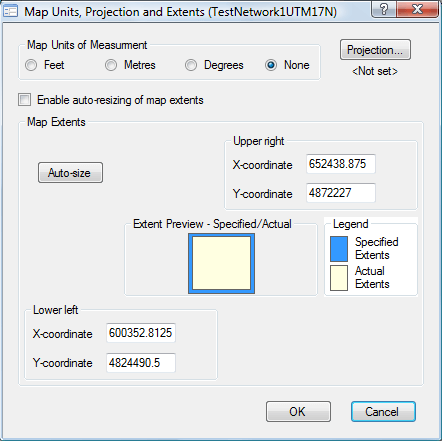
Units, Projection and Extents panel
WaterSums allows the flexibility of choosing different levels of complexity for different applications. If arbitrary coordinates are to be used for locating network objects, the units of measure and extents of the network can be [...]
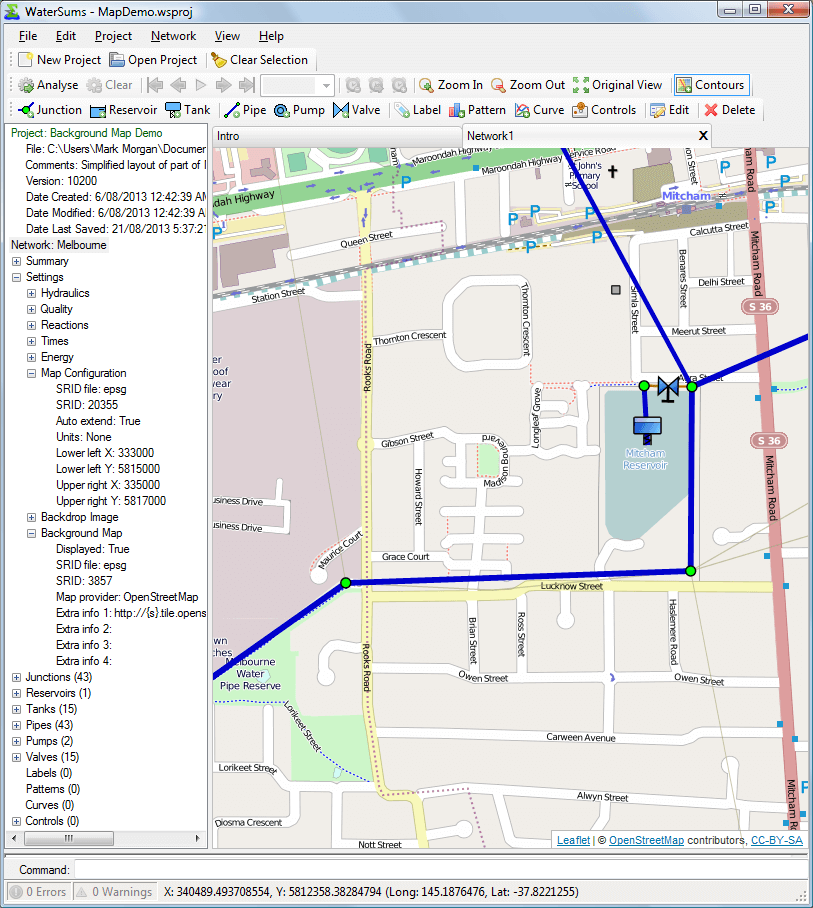
WaterSums Demo Project
MapDemo.wsproj Points of note OpenStreetMap (© OpenStreetMap contributors) background map of Melbourne, Australia. The network map configuration is shown in the project tree including the projection information (file: epsg, SRID: 20355). Background map configuration information [...]
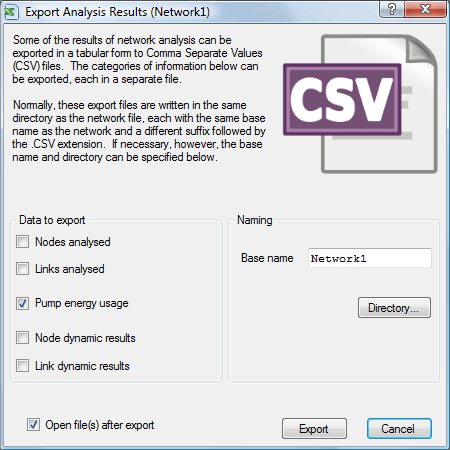
Export Analysis Results panel
Exporting Analysis Results to CSV files WaterSums uses the EPANET toolkit to analyse a water supply network. The results can then be exported to several Comma Separated Values (CSV) files and displayed immediately if desired.
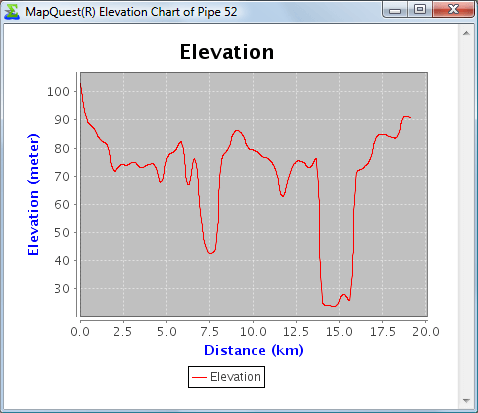
Pipe Elevation Chart (courtesy of MapQuest Open Elevation Service)
An elevation chart courtesy of MapQuest Open Elevation Service. The chart is generated on demand by the MapQuest service based on WaterSums providing the start and end location of a selected pipe as well as [...]
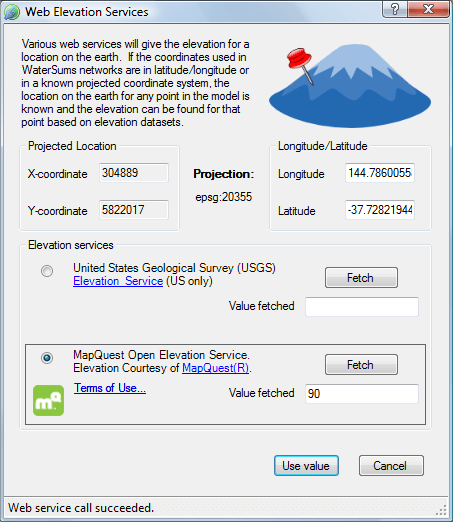
Web Elevation Services
WaterSums can now provide access to web elevation services to help with confirming elevations of nodes (junctions, reservoirs and tanks) in network models. Once an elevation is fetched from a web service, it can be [...]